
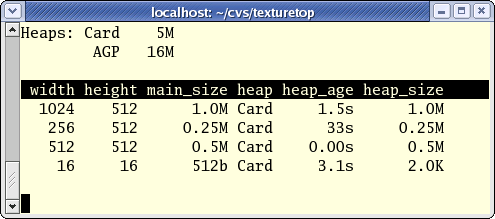
With the work I've been doing recently with luminocity, I realized that I had absolutely no idea of what was going on for video card memory usage. Rather than putting some one-off print statements into the card driver, I decided to try and make something a little more reusable and convenient. That Sunday-afternoon project ended up taking most of this week, but I'm pretty happy with the result: texturetop. The obligatory screenshot:
In order to have a decent chance of getting this upstream and out of my hands, texturetop is a text-mode client. No GTK+, no GLib. Actually, texturetop is just a minimal front end. The somewhat larger piece of work was adding code to Mesa/DRI to get it to connect to texturetop and provide the information. libGL and texturetop talk a text-based protocol over a socket, so it was an opportunity to dust off my “how to listen on a socket” skills as well as my “how to write a linked list by hand” skills.
We have dozens of profiling tools on Linux, from oprofile and valgrind, to memprof, xrestop, and texturetop. Is there some way that a "profiling console" could be created that would provide access to all this disparate information and integrate it together?